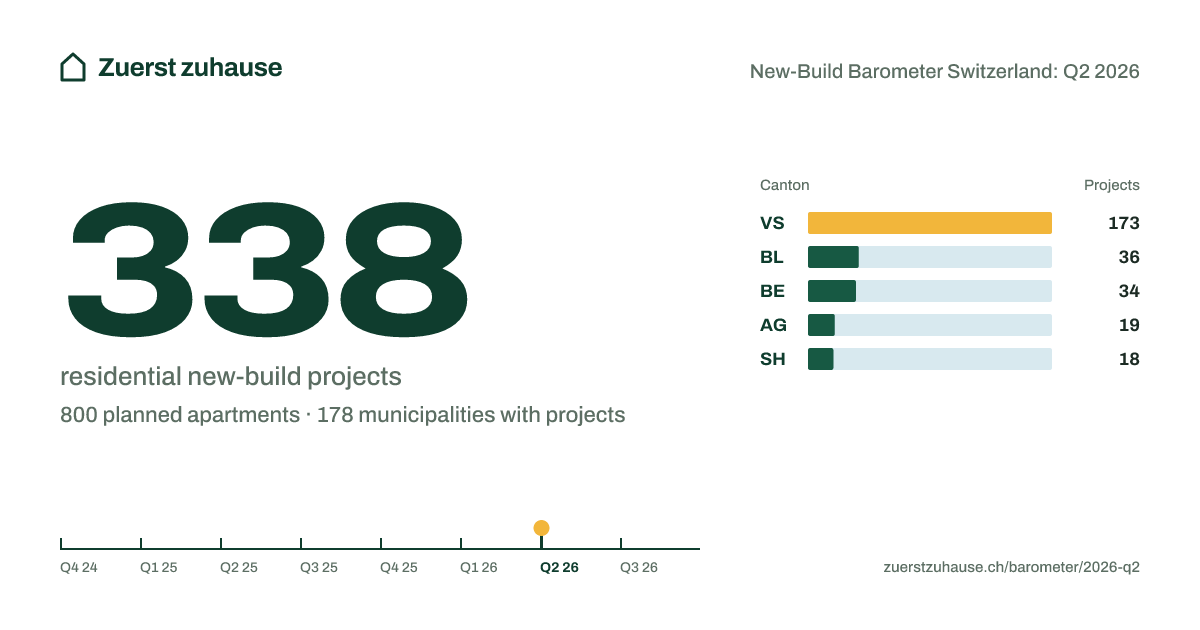
Every building application published in Switzerland in Q2 2026, broken down into residential new-build projects, planned apartments and municipalities. Source: cantonal gazettes and municipal publications, collected daily.
The sources were connected step by step through 2026; until the end of 2026 the series also reflects the growing coverage, not only building activity.
| Quarter | Projects | Apartments | Publications |
|---|---|---|---|
| Q4 2024 | 1 | 2 | 16 |
| Q1 2025 | 3 | 14 | 46 |
| Q2 2025 | 3 | 0 | 47 |
| Q3 2025 | 6 | 84 | 80 |
| Q4 2025 | 27 | 70 | 333 |
| Q1 2026 | 191 | 526 | 2,447 |
| Q2 2026 | 338 | 800 | 4,324 |
| Q3 2026 | 1,525 | 9,013 | 16,868 |
| Canton | Projects | Apartments |
|---|---|---|
| Valais | 173 | 461 |
| Basel-Landschaft | 36 | 43 |
| Bern | 34 | 73 |
| Aargau | 19 | 59 |
| Schaffhausen | 18 | 73 |
| Obwalden | 15 | 4 |
| Nidwalden | 12 | 5 |
| Grisons | 11 | 20 |
| Neuchâtel | 8 | 50 |
| Schwyz | 4 | 0 |
| Lucerne | 3 | 3 |
| Zurich | 2 | 1 |
| Ticino | 1 | 6 |
| Thurgau | 1 | 2 |
| Solothurn | 1 | 0 |
The figures may be reused freely with attribution. Citation: “New-Build Barometer Switzerland, Q2 2026, zuerstzuhause.ch”. The data on this page is available as JSON, the logo as an image.